Call Us Today! (+98 21) 88533266 | (+97 15) 56292960 | info@deeptechco.com

OEE Optimization

What is OEE?

OEE (Overall Equipment Effectiveness) is a “best practices” metric that identifies the percentage of planned production time that is truly productive. An OEE score of 100% represents perfect production: manufacturing only good parts, as fast as possible, with no downtime.

OEE is useful as both a benchmark and a baseline:

  • As a benchmark, OEE can be used to compare the performance of a given production asset to industry standards, to similar in-house assets, or to results for different shifts working on the same asset.
  • As a baseline, OEE can be used to track progress over time in eliminating waste from a given production asset.

OEE Benchmarks

So, as a benchmark, what is considered a “good” OEE score? What is a world-class OEE score?

  • 100% OEE is perfect production: manufacturing only good parts, as fast as possible, with no stop time.
  • 85% OEE is considered world class for discrete manufacturers. For many companies, it is a suitable long-term goal.
  • 60% OEE is fairly typical for discrete manufacturers, but indicates there is substantial room for improvement.
  • 40% OEE is not at all uncommon for manufacturing companies that are just starting to track and improve their manufacturing performance. It is a low score and in most cases can be easily improved through straightforward measures (e.g., by tracking stop time reasons and addressing the largest sources of downtime – one at a time).

Simple OEE Calculations

In simplest terms, OEE is the ratio of Fully Productive Time to Planned Production Time. In practice, OEE is calculated as:

Advanced OEE Calculation

The preferred way to calculate OEE is mathematically equivalent to the simple formula described above but provides a much richer understanding of waste in the manufacturing process by breaking it down into three factors:

  • Availability Loss
  • Performance Loss
  • Quality Loss

Availability Calculation

Availability takes into account Availability Loss, which includes all events that stop planned production for an appreciable length of time (typically several minutes or longer). Availability Loss includes Unplanned Stops (such as equipment failures and material shortages), and Planned Stops (such as changeover time).

Availability is calculated as the ratio of Run Time to Planned Production Time, where Run Time is simply Planned Production Time less Stop Time:

Availability = Run Time / Planned Production Time


Run Time = Planned Production Time − Stop Time


Performance Calculation

Performance takes into account Performance Loss, which includes all factors that cause the production asset to operate at less than the maximum possible speed when running (including Slow Cycles and Small Stops).

Performance is calculated as the ratio of Net Run Time to Run Time. In practice, it is calculated as:

Ideal Cycle Time is the theoretical fastest possible time to manufacture one piece. Therefore, when it is multiplied by Total Count the result is Net Run Time which is the theoretical fastest possible time to manufacture the total quantity of pieces.

Here is a simple example of a Performance calculation:

 
ItemValueExplanation
Ideal Cycle Time1 minuteTheoretical fastest time to produce this part.
Total Count300Total quantity of pieces manufactured during this shift.
Run Time330 minutesRun time of this shift (planned production time less stop time).
Performance90.9%(Ideal Cycle Time × Total Count) / Run Time = (1 × 300) / 330

Quality Calculation

Quality takes into account Quality Loss, which factors out manufactured pieces that do not meet quality standards, including pieces that are later reworked.

Quality is calculated as the ratio of Fully Productive Time (only Good Count manufactured as fast as possible with no Stop Time) to Net Run Time (fastest possible time for Total Count). In practice, it is calculated as:

Final OEE Calculation

OEE takes into account all losses (Stop Time Loss, Speed Loss, and Quality Loss), resulting in a measure of truly productive manufacturing time.

OEE is calculated as the ratio of Fully Productive Time to Planned Production Time. In practice, it is calculated as:

If the equations for Availability, Performance, and Quality are substituted in the above equation and then reduced to their simplest terms the result is:

This is the “simplest” OEE calculation described earlier. With a bit of reflection, it can be seen that multiplying Good Count by Ideal Cycle Time results in Fully Productive Time (manufacturing only good parts, as fast as possible, with no stop time). 

Perfect Production

Earlier, an OEE score of 100% was described as perfect production: manufacturing only good parts, as fast as possible, with no stop time. Let’s tie this notion of perfect production to the OEE calculation:

  • Manufacturing only good parts means a Quality score of 100%
  • As fast as possible means a Performance score of 100%
  • With no stop time means an Availability score of 100%

Working through real-world examples is a great way to master the OEE calculation. For free worked examples, templates, spreadsheets, and other resources visit: https://www.oee.com.

OEE Optimization with AI

Industry 4.0 has emerged as the perfect scenario for boosting the application of novel artificial intelligence (AI) and machine learning (ML) solutions to industrial process monitoring and optimization. Artificial intelligence is a set of techniques and methodologies aimed at allowing machines, especially computer systems, to simulate human intelligence processes. Machine learning is a subset of artificial intelligence, which provides a set of methodologies and strategies to allow systems for improvement. ML relies in automatic learning procedures, which generate knowledge from previous experiences (data).

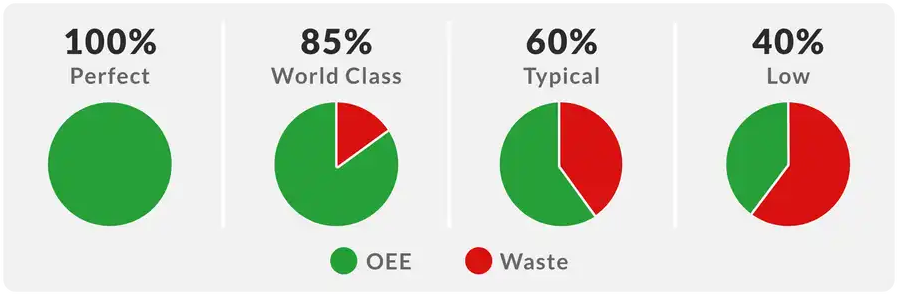
One of the key elements on this new industrial revolution is the hatching of massive process monitoring data, enabled by the cyber-physical systems (CPS) distributed along the manufacturing processes, the proliferation of hybrid Internet of Things architectures supported by polyglot data repositories, and big data analytics capabilities. Industry 4.0 paradigm is data-driven, where the smart exploitation of data is providing a large set of competitive advantages impacting productivity, quality, and efficiency KPIs. OEE has emerged as the target KPI for most manufacturing industries due to the fact that considers three key indicators: availability, quality, and performance.

Therefore, there is an opportunity on improving the performance of manufacturing processes taking as input those new streams of information; going through analytical processes; creating new supporting models, tools, and services; and benchmarking their recommendations and outcomes against classical approaches. To that end, the OEE is aimed at measuring types of production losses and indicating areas of process improvement, ideal to be used as a benchmarking KPI, and one of the main indicators used in manufacturing execution systems (MES).

Example of How AI Can Optimize OEE

There are many ways that we can optimize OEE of a manufacturing plant with AI. As an example, we can look to the following three approaches to improve the OEE KPI:

  • Setup: We can improve the time needed to set up or adapt the environment, lines, and tools when a new incoming work order arrives, considering results from previous similar experiences. As we are able to do it in less time, and in a more effective way, we are impacting to the availability of the assets, and consequently, improving the OEE.

  • Process deviations: In a similar way, AI allows for quality prediction relying on process parameters, which combined with real-time tuning of execution parameters, results in better quality outcomes, and scrap reduction, again, improving OEE.

  • Maintenance: Predictive maintenance allows us to plan and provision with the needed spare parts so that impact in production is minimized. With this management we improve availability, and therefore, OEE is also improved.