
Oil and gas companies face the challenge of obtaining insight from an enormous amount of data to make better, more informed decisions. To innovate exploration and production, you need to make sense of operational data from the plant floor, supply chains and connected products.
Big Data or Big Data analytics refers to a new technology which can be employed to handle large datasets which include six main characteristics of volume, variety, velocity, veracity, value, and complexity. With the recent advent of data recording sensors in exploration, drilling and production operations, oil and gas industry has become a massive data intensive industry.
Analyzing seismic and micro-seismic data, improving reservoir characterization and simulation, reducing drilling time and increasing drilling safety, optimization of the performance of production pumps, improved petrochemical asset management, improved shipping and transportation, and improved occupational safety are among some of the applications of Big Data in oil and gas industry.
By applying big data analytics, oil and gas companies can identify trends and predict events throughout processes to quickly respond to disruptions and improve efficiencies. To push capabilities further, implementing automation and AI helps the oil and gas industry surpass human limitations to enable the type of decision making that keeps operations running at full speed and optimizes drilling and production. This shift to digitization and use of big data positions your organization to lead the field in shaping the next generation of oil and gas innovations.
Big Data Definition
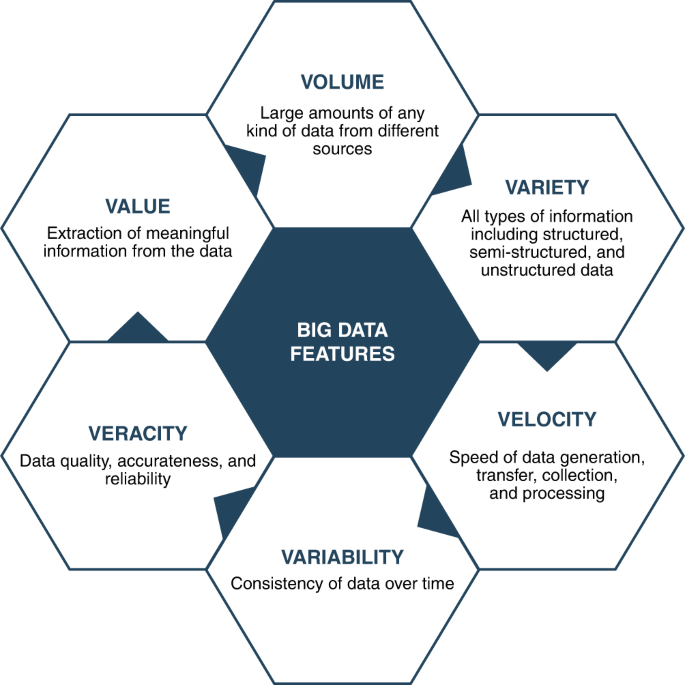
Big data includes unstructured (not organized and text-heavy) and multi-structured data (including different data formats resulting from people/machines interactions). The term Big Data (also called Big Data Analytics) defines the first characteristic of this method and that is the size of the available data set. There are other characteristics related to the data which make it viable for Big Data tools. Those 6Vs characteristics refer to:
- Volume: Volume refers to the quantity of data or information. These data can come from any sensor or data recording tool. This vast quantity of data is challenging to be handled due to storage, sustainability, and analysis issues. Many companies are dealing with huge volume of data in their archives; however, they do not have the capability of processing these data. The main application of Big Data is to provide processing and analysis tools for the increasing amounts of data.
- Variety: Variety refers to the various types of data which are generated, stored, and analyzed. The data recording devices and sensors are different in types and as a result the generated data can be in different sizes and formats. The formats of the generated data can be in text, image, audio, or video. The classification can be done in a more technical way as structured, semi-structured, and unstructured data. The majority of oil and gas generated data from SCADA systems, surface and subsurface facilities, drilling data, and production data are structured data. These data could be time series data which have been recorded through a certain course of time. Another source of structured data includes the asset, risk, and project management reports. There would be also external structured data sources such as market prices and weather data, which can be used for forecasting. The sources of unstructured data in oil and gas industry include well logs, daily written reports of drilling, and CAD drawing. The sources of semi-structured data include processed data as a result of modeling and simulation.
- Velocity: Velocity as a characteristic of Big Data refers to the speed of data transmission and processing. It also refers to the fast pace of data generation. The challenging issue about the velocity component is the limited number of available processing units compared to the volume of data. Recently, the data generation velocity is huge, as a data of 5 exabyte is generated just in two days. This is equivalent to the total amount of data created by humans until 2003. The velocity characteristic is even more prominent for oil and gas industry due to complex nature of various petroleum engineering problems. There are many cases in which real time and fast processing of data is crucial in oil and gas industry. For example, fast processing of well data during drilling can result in identifying risks and preventing destructive blow-outs efficiently.
- Veracity: Veracity refers to the quality and usefulness of the available data for the purpose of analysis and decision making. It is about distinguishing between clean and dirty data. This is very important as the dirty data can significantly affect the velocity and accuracy of data analysis. The generated data should be professionally and efficiently processed and filtered to be used for data analysis; otherwise, the results will not be reliable. The veracity of data is challenging in oil and gas industry specifically due to nature of data, which mainly comes from subsurface facilities and it might include uncertainty. Another challenge comes from the data collected by conventional manual data recording, which is done by human operators.
- Value: Value is a very significant characteristic of the Big Data. The returned value of investments for Big Data infrastructures is of a great importance. Big Data analyzes huge data sets to reveal the underlying trends and help the engineers to forecast the potential issues. Knowing the future performance of equipment used during operation and identifying the failures before happening can make the company to have competitive advantage and bring value to the company.
- Variability: Variability refers to the fact that data changes during processing and lifecycle.
Complexity of the problem for which the data gathering is conducted is another important characteristic. Dealing with large data sets which are coming from a complex computing problem is sophisticated and finding the underlying trend can be challenging. For these problems Big Data tools can be very helpful.
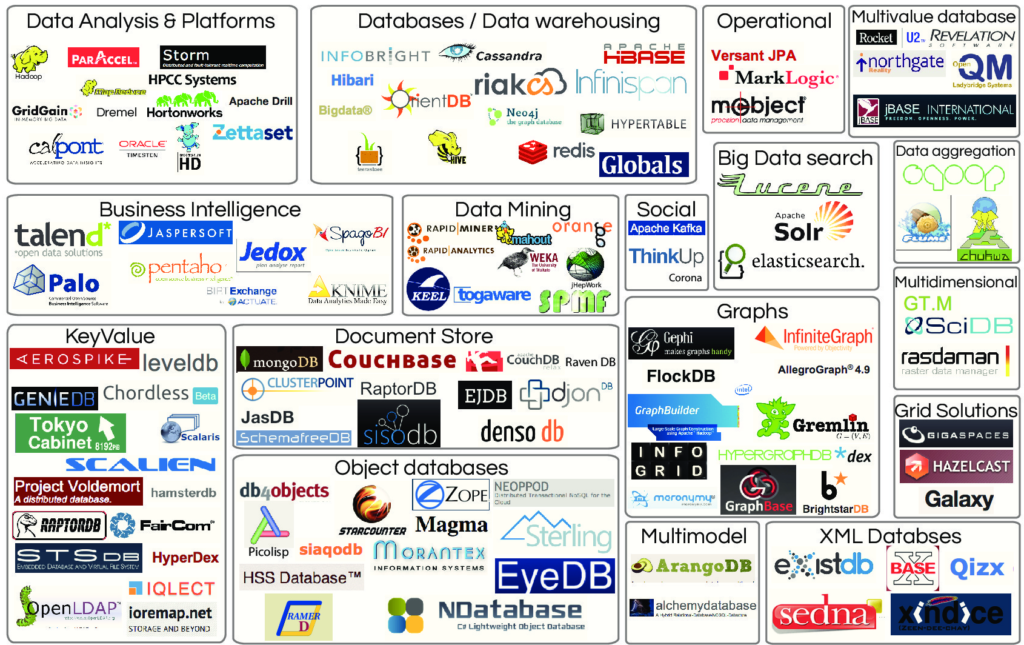
Big Data Technologies
As the Big Data is involving huge data sets and, in some cases, complicated problems, it is very important to have access to innovative and powerful technologies. Here, some of these most widely used technologies are introduced.
Apache Hadoop
A distributed framework for storing data and running applications on clusters of commodity hardware, Hadoop was developed as a pioneering big data technology to help handle the growing volumes of structured, unstructured and semi-structured data. First released in 2006, it was almost synonymous with big data early on; it has since been partially eclipsed by other technologies but is still widely used.
Hadoop has four primary components:
- the Hadoop Distributed File System (HDFS), which splits data into blocks for storage on the nodes in a cluster, uses replication methods to prevent data loss and manages access to the data;
- YARN, short for Yet Another Resource Negotiator, which schedules jobs to run on cluster nodes and allocates system resources to them;
- Hadoop MapReduce, a built-in batch processing engine that splits up large computations and runs them on different nodes for speed and load balancing; and
- Hadoop Common, a shared set of utilities and libraries.
Initially, Hadoop was limited to running MapReduce batch applications. The addition of YARN in 2013 opened it up to other processing engines and use cases, but the framework is still closely associated with MapReduce. The broader Apache Hadoop ecosystem also includes various big data tools and additional frameworks for processing, managing and analyzing big data.
Apache Spark
Apache Spark is an in-memory data processing and analytics engine that can run on clusters managed by Hadoop YARN, Mesos and Kubernetes or in a standalone mode. It enables large-scale data transformations and analysis and can be used for both batch and streaming applications, as well as machine learning and graph processing use cases. That’s all supported by the following set of built-in modules and libraries:
- Spark SQL, for optimized processing of structured data via SQL queries;
- Spark Streaming and Structured Streaming, two stream processing modules;
- MLlib, a machine learning library that includes algorithms and related tools; and
- GraphX, an API that adds support for graph applications.
Data can be accessed from various sources, including HDFS, relational and NoSQL databases, and flat-file data sets. Spark also supports various file formats and offers a diverse set of APIs for developers.
But its biggest calling card is speed: Spark’s developers claim it can perform up to 100 times faster than traditional counterpart MapReduce on batch jobs when processing in memory. As a result, Spark has become the top choice for many batch applications in big data environments, while also functioning as a general-purpose engine. First developed at the University of California, Berkeley and now maintained by Apache, it can also process on disk when data sets are too large to fit into the available memory.
Apache Kafka
Apache Kafka is a distributed event streaming platform that, according to Apache, is used by more than 80% of Fortune 100 companies and thousands of other organizations for high-performance data pipelines, streaming analytics, data integration and mission-critical applications. In simpler terms, Kafka is a framework for storing, reading and analyzing streaming data.
The technology decouples data streams and systems, holding the data streams so they can then be used elsewhere. It runs in a distributed environment and uses a high-performance TCP network protocol to communicate with systems and applications. Kafka was created by LinkedIn before being passed on to Apache in 2011.
The following are some of the key components in Kafka:
- a set of five core APIs for Java and the Scala programming language;
- fault tolerance for both servers and clients in Kafka clusters; and
- elastic scalability to up to 1,000 “brokers,” or storage servers, per cluster.
Apache Airflow
Apache Airflow is a workflow management platform for scheduling and running complex data pipelines in big data systems. It enables data engineers and other users to ensure that each task in a workflow is executed in the designated order and has access to the required system resources. Airflow is also promoted as easy to use: Workflows are created in the Python programming language, and it can be used for building machine learning models, transferring data and various other purposes.
The platform originated at Airbnb in late 2014 and was officially announced as an open source technology in mid-2015; it joined the Apache Software Foundation’s incubator program the following year and became an Apache top-level project in 2019. Airflow also includes the following key features:
- a modular and scalable architecture built around the concept of directed acyclic graphs (DAGs), which illustrate the dependencies between the different tasks in workflows;
- a web application UI to visualize data pipelines, monitor their production status and troubleshoot problems; and
- ready-made integrations with major cloud platforms and other third-party services.
Apache Flink
Another Apache open source technology, Flink is a stream processing framework for distributed, high-performing and always-available applications. It supports stateful computations over both bounded and unbounded data streams and can be used for batch, graph and iterative processing.
One of the main benefits of Flink is its speed: It can process millions of events in real time for low latency and high throughput. Flink, which is designed to run in all common cluster environments, also includes the following features:
- in-memory computations with the ability to access disk storage when needed;
- three layers of APIs for creating different types of applications; and
- a set of libraries for complex event processing, machine learning and other common big data use cases.
Apache Druid
Druid is a real-time analytics database that delivers low latency for queries, high concurrency, multi-tenant capabilities and instant visibility into streaming data. Multiple end users can query the data stored in Druid at the same time with no impact on performance, according to its proponents.
Written in Java and created in 2011, Druid became an Apache technology in 2018. It’s generally considered a high-performance alternative to traditional data warehouses that’s best suited to event-driven data. Like a data warehouse, it uses column-oriented storage and can load files in batch mode. But it also incorporates features from search systems and time series databases, including the following:
- native inverted search indexes to speed up searches and data filtering;
- time-based data partitioning and querying; and
- flexible schemas with native support for semi-structured and nested data.
Apache Hive
Hive is SQL-based data warehouse infrastructure software for reading, writing and managing large data sets in distributed storage environments. It was created by Facebook but then open sourced to Apache, which continues to develop and maintain the technology.
Hive runs on top of Hadoop and is used to process structured data; more specifically, it’s used for data summarization and analysis, as well as for querying large amounts of data. Although it can’t be used for online transaction processing, real-time updates, and queries or jobs that require low-latency data retrieval, Hive is described by its developers as scalable, fast and flexible. Other key features include the following:
- standard SQL functionality for data querying and analytics;
- a built-in mechanism to help users impose structure on different data formats; and
- access to HDFS files and ones stored in other systems, such as the Apache HBase database.
The ELK Stack
The ELK Stack (Elasticsearch, Logstash, and Kibana) is the world’s most popular open-source log analysis platform. ELK is quickly overtaking existing proprietary solutions and becoming companies’ top choice for log analysis and management solutions.
- Elasticsearch: Stores and indexes transformed data from Logstash.
- Logstash: Collect logs and events data. Also parses and transforms data and sends it to Elasticsearch.
- Kibana: A visualization tool that runs alongside Elasticsearch to allow users to analyze data and build powerful reports.
Top companies that use ELK Stack include Netflix, LinkedIn, Stack Overflow and others. This shouldn’t be surprising, if we consider all of the critical capabilities and services that that this one stack provides:
- A central logging system for all microservices, with real-time logging analytics and alerting system.
- Simplified Scales deployment, vertically and horizontally.
- A data visualization tool to capture and display analytics, i.e., new customer acquired in a day, API fails after a new release and more.
MongoDB
MongoDB, the most popular NoSQL database, is an open-source document-oriented database. The term ‘NoSQL’ means ‘non-relational’. It means that MongoDB isn’t based on the table-like relational database structure but provides an altogether different mechanism for storage and retrieval of data.
MongoDB is preferred over RDBMS in the following scenarios:
- Big Data: If you have huge amount of data to be stored in tables, think of MongoDB before RDBMS databases. MongoDB has built-in solution for partitioning and Sharding your database.
- Unstable Schema: Adding a new column in RDBMS is hard whereas MongoDB is schema-less. Adding a new field does not affect old documents and will be very easy.
- Distributed data: Since multiple copies of data are stored across different servers, recovery of data is instant and safe even if there is a hardware failure.
Cassandra
Cassandra is the only distributed NoSQL database that delivers the always-on availability, blisteringly fast read-write performance, and unlimited linear scalability needed to meet the demands of successful modern applications. Cassandra delivers the continuous availability (zero downtime), high performance, and linear scalability that modern applications require, while also offering operational simplicity and effortless replication across data centers and geographies. It can handle petabytes of information and thousands of concurrent operations per second, enabling organizations to manage large amounts of data across hybrid and multi-cloud environments. Most Important features of Cassandra are:
- Flexible, familiar interface
- High performance
- Active everywhere with zero downtime
- Scalability
- Seamless replication
Trino
Trino enables users to query data regardless of where it’s stored, with support for natively running queries in Hadoop and other data repositories. Trino:
- is built for both ad hoc interactive analytics and long-running batch queries;
- support for querying data in Hive, various databases and proprietary data stores;
- the ability to combine data from multiple sources in a single query; and
- query response times that typically range from less than a second to minutes.
- works with Tableau, Power BI, R and other BI and analytics tools.
Big Data in the Oil and Gas Industry
Large volume of data is generated from day to day operations in Oli & Gas industry. Big data analytics assists in streamlining key oil and gas operations, such as exploration, drilling, production and delivery, in the three sectors – upstream, midstream and downstream.
Big Data in the Upstream Sector
Oil & Gas companies use thousands of sensors installed in subsurface wells and surface facilities to provide continuous data-collecting, real-time monitoring of assets and environmental conditions. The data volume is coming from sensors, spatial and GPS coordinates, weather services, seismic data, and various measuring devices. “Structured” data is handled with specific applications used to manage surveying, processing and imaging, exploration planning, reservoir modelling, production, and other upstream activities. But much of this data is “unstructured” or “semi-structured” such as emails, word processing documents, spreadsheets, images, voice recordings, multimedia, and data market feeds, which means it is difficult or costly to either store in traditional data warehouses or routinely query and analyze. In this case, appropriate tools for Big Data should be used.
To support the real-time decision-making, Oil & Gas companies need tools that integrate and synthesize diverse data sources into a unified whole. Being able to process Big Data makes it possible to derive insight from the relationships that will surface when all of these sources are processed as a whole. But to unlock this value, Oil & Gas companies need access to the appropriate technology, tools, and expertise.
Like generic Big Data, the Upstream Data is also characterized by the 6Vs as shown in the next Figure:
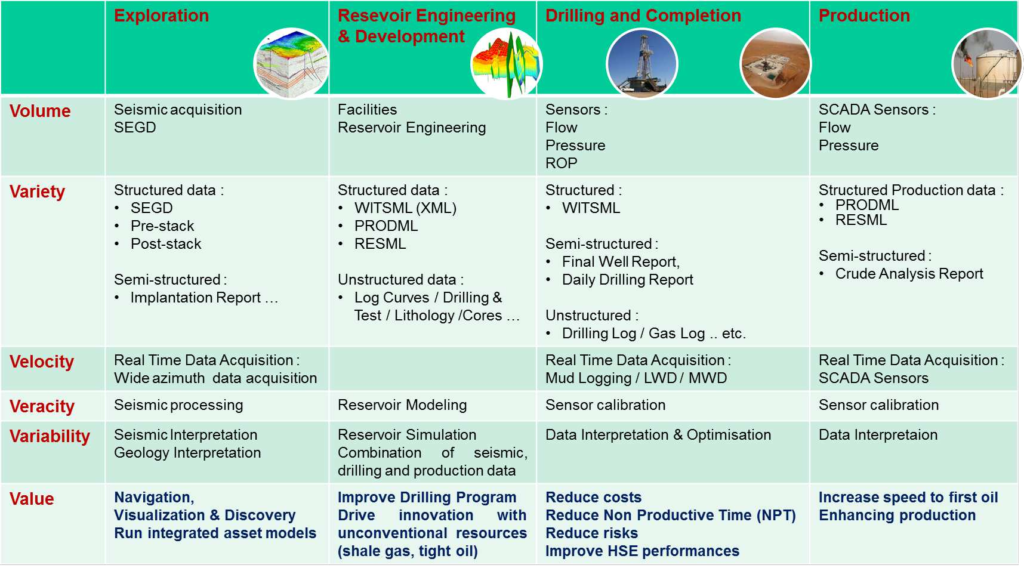
Exploration and Development
By combination of Big Data and advanced analytics in Exploration and Development activities, managers and experts can perform strategic and operational decision-making. The areas where the analytics tools associated with Big Data can benefit Oil & Gas exploration include:
- Enhancing exploration efforts: Historical drilling and production data help geologists and geophysicists verify their assumptions in their analysis of a field where environmental regulations restrict new surveys.
- Combine enterprise data with real-time production data: Deliver new insights to operating teams for enhancing exploration efforts.
- Assessing new prospects: Create competitive intelligence using Analytics applied to geospatial data, oil and gas reports and other syndicated feeds in order to bid for new prospects. Identifying seismic traces: using advanced analytics based on Hadoop and distributed Database for storage, quick visualization and comprehensive processing and imaging of seismic data to identify potentially productive seismic trace signatures previously.
- Build new scientific models: By using high performance computing and based on combination between “historical data” and “Real Time Data Acquisition”: Petabyte seismic data sets, Mud Logging, MWD, LWD, Testing, Gamma Ray.
Drilling and Completion
It can be valuable making the drilling platforms and pipeline infrastructure smart to anticipating issues and acting to prevent failures and increase productivity. In this case, Big Data is used to identify conditions or anomalies that would impact on drilling operations can save human lives and equipment. Real-time information returned from supervisory control and data acquisition systems on well-heads can be used to grasp opportunities that maximize asset performance and optimize production.
Related areas where Big Data Analytics can improve drilling and completion operations are:
- Build and assessment of drilling models: based on all existing well data. These models are incorporated with geologic measurement into drilling processes, such as shale development. This will refresh models based on incoming sensor data from drill rig and help to optimize drill parameters.
- Improve Drill Accuracy and Safety: by early identifying anomalies that would impact drilling and prevent undesired events: kicks, blowout, etc.
- Drilling optimization: predictive Analytics help to reduce NPT (Non Productive Time), by early identifying the negative impacting factors of drilling operations.
- Cost optimization: by using scalable compute technologies to determine optimum cost.
- Real-time decision-making: must act in real time on drilling data and formation evaluation data and use this data for predictive modelling to facilitate real-time decision-making.
- Predictive maintenance: predict drill maintenance/downtime.
Production
Producing oil and gas involves drilling and completing the wells, connecting them to pipelines and then keeping the flow of the hydrocarbons at an optimum rate, all integrally related to the subsurface environment. The path to optimizing production is dependent on the type of rock and structure of the reservoir. These decisions depend heavily on models created in the exploration phase. Big Data is of great interest to production and operation work. Being able to predict future performance based on historical results, or to identify sub-par production zones, can be used to shift assets to more productive areas. Oil recovery rates can be improved, as well, by integrating and analyzing seismic, drilling, and production data to provide self-service business intelligence to reservoir engineers.
- Enhanced oil recovery: enhancing oil recovery from existing wells is a key objective for oil and gas companies. Analytics applied to a variety of Big Data at once (seismic, drilling, and production data) could help reservoir engineers map changes in the reservoir over time and provide decision support to production engineers for making changes in lifting methods. This type of approach could also be used to guide fracking in shale gas plays.
- Performance forecasting: forecast production at thousands of wells. Aging wells where the forecast does not meet a predetermined production threshold are flagged for immediate remediation.
- Real-time production optimization: Real-time SCADA and process control systems combined with analytics tools help Oil & Gas producer to optimize resource allocation and prices by using scalable compute technologies to determine optimum commodity pricing. They also, help to make more real time decisions with fewer engineers.
- Improve Safety and prevent risks: by early detecting well problems before they become serious (slugging, WAG (Water Alternating Gas) gas breakthrough).
Equipment Maintenance
Predictive maintenance is not a new concept for the oil and gas industry. In upstream, if pressure, volume, and temperature can be collected and analyzed together and compared with the past history of equipment failure, advanced analytics can be applied to predict potential failures. Additionally, many upstream operations are in remote locations or on ships, so being able to plan maintenance on critical assets is important, especially if work requires purchase of specialized equipment. Technicians often use data collected from pumps and wells to adjust repair schedules and prevent or anticipate failure. Better predictive maintenance also becomes possible:
- Preventing down time: understand how maintenance intervals are affected by variables such as pressure, temperature, volume, shock, and vibration to prevent failure and associated downtime.
- Optimizing field scheduling: use this insight to predict equipment failures and enable teams to more effectively schedule equipment maintenance in the field.
- Improving shop floor maintenance planning: integrate well and tool maintenance data with supply chain information to optimize scheduling of shop floor maintenance.
Potential drilling errors or equipment failures can be identified in advance by analyzing the sensor data (from equipment such as drill heads, down hole sensors, etc.) as well as geological data and thus telling what equipment works best in which environment.
Reservoir Engineering
Oil & Gas companies improve understanding of future strategy based on available oil for a better identification of reservoirs and reserves by integrate real-time data into the earth model both on the rig and in the office. Also, they predict the chances of success of turning reservoir into a production well by:
- Improving engineering studies: engage sophisticated subsurface models and conduct detailed engineering studies on wells to identify commercial prospects earlier and with less risk.
- Optimizing subsurface understanding: use Big Data tools to understand the earth’s subsurface better and to deliver more affordable energy, safely and sustainably.
- Experiences and learned lessons from drilling operations: such determination of drilling coordinates through oil shale to optimize the number of wellheads needed for efficient extraction of oil, optimization of drilling resources by not over drilling well site, reducing waste of drilling exploration wells, etc.
Big Data in the Midstream Sector
The ‘midstream’ segment of the oil and natural gas industry refers to anything required to transport and store crude oil and natural gas before they are refined and processed into fuels and key elements needed to make a very long list of products, we use every day. Midstream includes pipelines and all the infrastructure needed to move these resources long distances, such as pumping stations, tank trucks, rail tank cars and transcontinental tankers.
Logistics in the petroleum industry is incredibly complex and the major concern is to transport oil and gas with the lowest risk possible. Companies utilize sensor analytics to ensure the safe logistics of their energy product. Predictive maintenance software analyzes sensor data from pipelines and tankers to detect abnormalities (fatigue cracks, stress corrosion, seismic ground movements, etc.), which allows preventing accidents. Oil and gas enterprises can employ big data predictive analytics to reduce downtimes and maintenance costs of the refining equipment, thus improving asset management.

Big Data in the Downstream Sector
Oil and gas enterprises can employ big data predictive analytics and data management solutions to help downstream energy businesses streamline operations, improve efficiency, and minimize risk and reduce downtimes and maintenance costs of the refining equipment, thus improving asset management. Big Data analytics could potentially benefit the downstream segment in:
- Optimize Pricing, Minimize Financial Risk: The downstream energy sector maximizes profits by tracking and analyzing a vast amount of data such as resource availability, usage, and predicted changes. Big Data management instrument can help with Big Data analytics, featuring the Hadoop file system.
- Efficient Data Collection and Delivery: It is needed uninterrupted access to all data all the time. Big Data analysis gives a stable storage infrastructure for enterprise data.
- Regulatory Compliance: Real-time monitoring of pipeline and refinery equipment health helps downstream energy companies comply with environmental and safety regulations. Cost-effective solutions can help store and manage the massive amounts of data these apps produce.
The use of Big Data Analytics in processing, logistics and sales is predicted to cause a breakthrough. Big Data can contribute to predicting the demand for oil products in the retail sales network and to analyze the pricing and the changes in prices by the competitors and the regions. Due to the discovered patterns, the opportunities of increasing the sale of related products and reducing delays in retail network (through more precise logistics of fuel-carrying vehicles) may also be attractive.
Big Data Analytics Enhances Security
Oil & Gas companies anticipate IT security breaches by using predictive analytics and bolstering security with data from the global protection systems including video monitoring, access control et anti-intrusion. Also, there is particular interest in deploying complex event processing (CEP) technology to monitor security concerns in the Oil & Gas industry in real time by:
- Combining data from multiple sources to infer events or patterns that indicate a current or imminent threat.
- Making faster decisions, supported by faster delivery of decision support information, to identify possible threats.
- Predict/prevent cyber-terror acts.
Oil companies need to identify events or patterns that could indicate an impending security threat or cyber-terrorist act in order to keep their personnel, property and equipment safe. Predictive analytics is central part of identifying patterns that can help detect these threats beforehand. The threats can be identified in real-time through machine learning and anomaly detection techniques and reducing the likelihood of such incidents.
Big Data Supporting HSE Operations
Big Data contributes significantly to reduce risk and optimize costs related to operations and Health, Safety and Environment:
- Prevent undesired events while drilling like kicks,
- Predict drill maintenance/downtime, optimize drill parameters and prevent blowout accidents,
- Using weather or workforce scheduling data to avoid creating dangerous conditions for workers and mitigating environmental risks.
By using Big Data tools to examine data from a variety of sources, well problems can be detected before they become serious, anomalies in drilling can be identified in real time, and drills can be proactively shut down in order to prevent environmental risks. Big Data analytics can be used to enhance the environmental health and safety of oil rigs and drills through identification of patterns and outliers before any catastrophic incidents occur.
Conclusion

The oil and gas industry are intensively using data and it necessitates Big Data technologies that enable the maximum use of different types of rapidly increasing data. Real time Big Data analytics may ensure more efficient oil production, reduce the costs and risks, improve security and compliance with regulatory requirements and the quality of decisions. The introduction of Big Data technologies can be an important step toward the implementation of corporate strategies for the complex intellectualization of the production of the of oil and gas companies.
Oil & Gas companies need first to proceed to a gap analysis to determine the major requirements of technology and data-management expert staff. This allows a focused investment in mature and proven technologies as well as those who will face the exponential growth of data volumes. Then Oil & Gas companies can create new strategies that will help them manipulate these data and use them to support experts in their business process and managers in their decision-making process.
By recognizing the value of the unexploited data assets in supporting fact-based decision-making, Oil & Gas companies establish real cases of Big Data uses. Then they can create enhanced business value based on innovation and able to lead towards a sustainable competitive advantage. With big Data analytics, companies transform enormous datasets into sound oil and gas exploration decisions, reduced operational costs, extended equipment lifespan, and lower environmental impact.
Our professionals supported by domain experts have strong expertise in the most relevant tech stack for implementing big data, business intelligence, data science, AI/machine learning solutions. Our big data experts can help you with big data architecture design, cloud-based big data solutions, data science software, machine learning algorithms, as well as customized data science applications and reports. To learn more, contact us.